Recapitulation
This program was used so far to study two datasets: Deaths in France 1970 - 2025 (abbreviateddeath-fr and death-fr2) and Births in France in 2000 (abbreviated a00).
The question is now to see if the methodology is correct and if the computations don't contain any bugs. Unit tests (tests for each function), functional tests (tests for each step of the computation) and verification tests (tests on the results of real computations) were written and confirm that the code is ok. But this can give a false impression of security, because the tests themselves can be bugged or not designed correctly, leading for example to test the code only partially. So the existence of bugs should be considered as possible.
To form an opinion on the output, have in mind that the expected values for one-dimensional arrays were computed using control groups, and for two-dimensional arrays, the average method was used. This method might not be appropriate and lead to meaningless high chi-square values (see below).
Some results look suspicious:
-
The Output of the program shows coherent results for most single dates: comparisons between observed and expected distributions give a low chi-square and a p-value = 1. This is normal because control groups are built by looping on one date (birth date for
death-frand mother date fora00) and randomly select the other dates.
But some distributions need explanations : why do some distributions of planetary positions of single dates show high chi-square values ? This is the case for death date indeath-frand wedding date ina00. -
Several distributions give high values of chi-square because the observed curve fits approximately the expected distribution, but not exactly, for example:
 This kind of curve gives a very low p-value, but can it be considered as an anomaly, is there a methodology to identify these cases ?
-
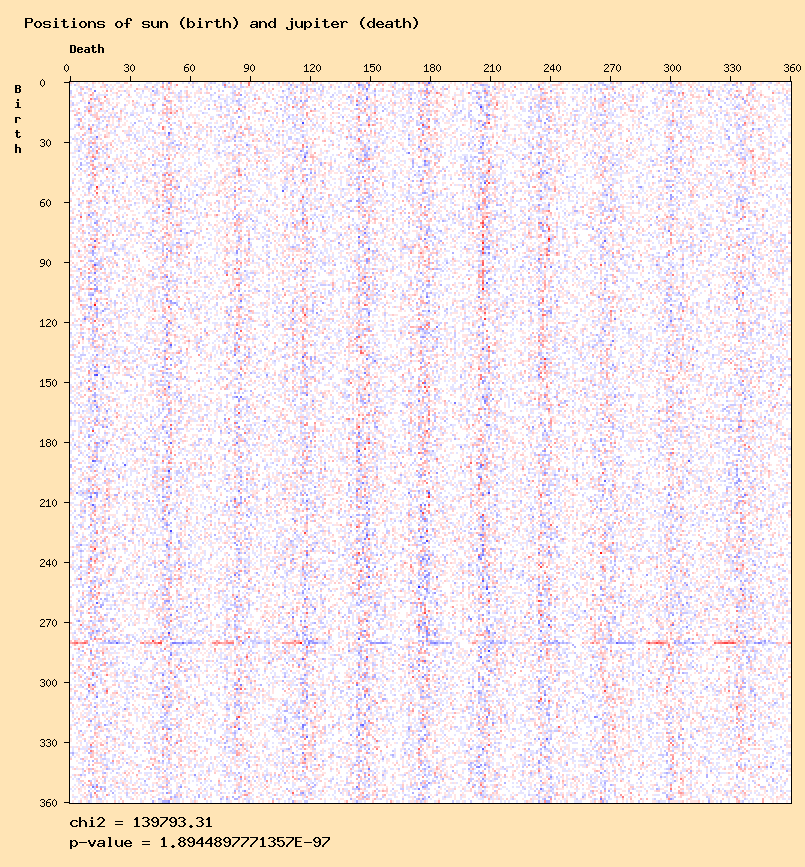
The Sun at birth - sun at death distribution. As explained in the page about death-fr study, when the persons deceased before their first birthday are removed, most of the "same planet excesses" disappear.
The excess remains for sun - sun distribution, which seems to confirm the observations of Didier Castille described in his article "A Link between Birth and Death". Curiously, this is visible on the one-dimensional view, but not clearly(?) in the two-dimensional view. It might be interesting to convert the 360 ditributions to bins of 10 or 30° to have a better view. -
The interaspects between same planets of mother and father in the
a00study.
The sun - sun distribution seems to confirm the results of Didier Castille and Gunter Sachs. But other anomalies can be observed for other planets except for the moon and mercury. The question is to find out if these are "real" anomalies, or meaningless results that can be eliminated.
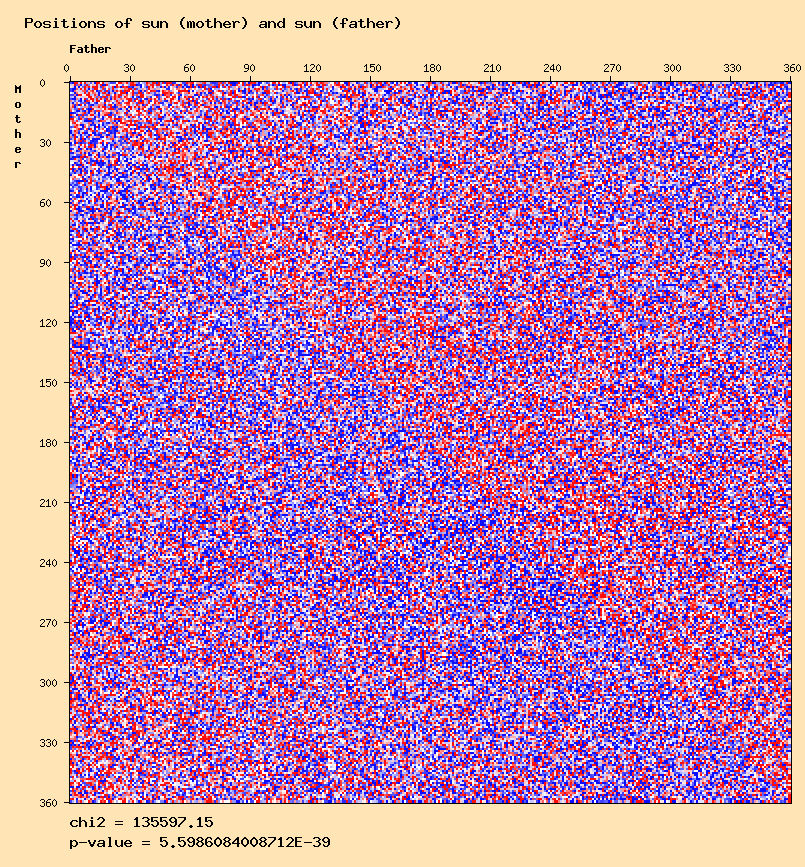
Sun mother - sun father 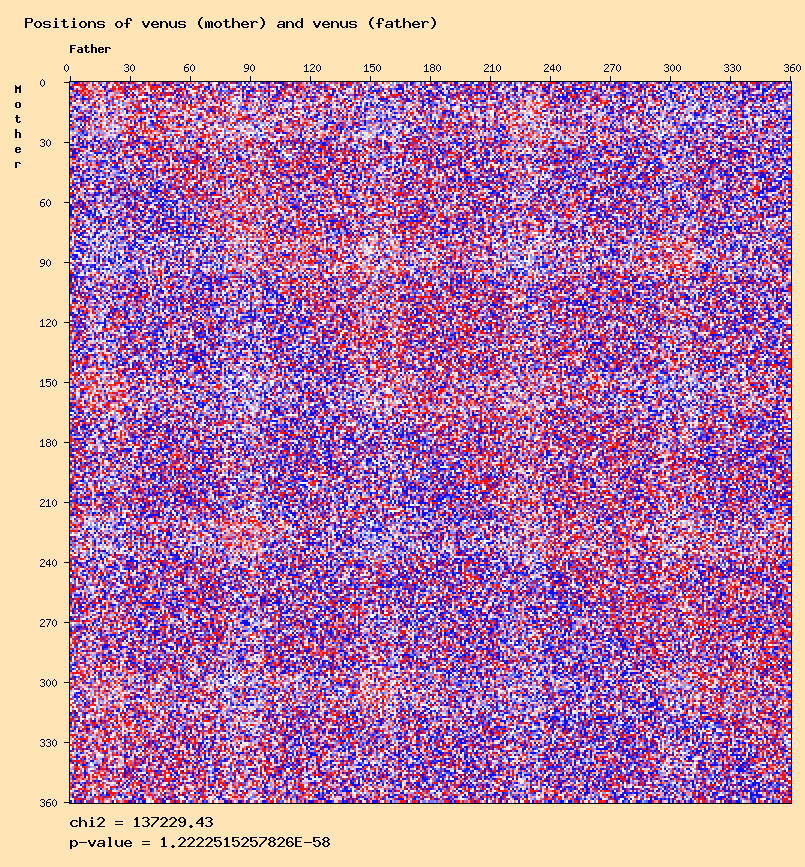
Venus mother - venus father 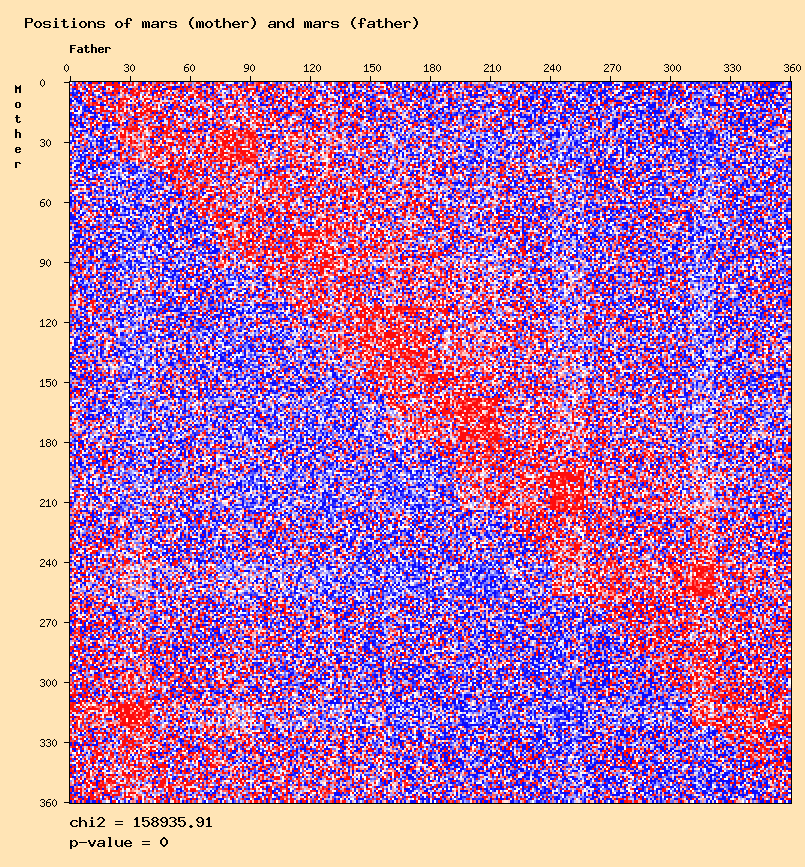
Mars mother - mars father 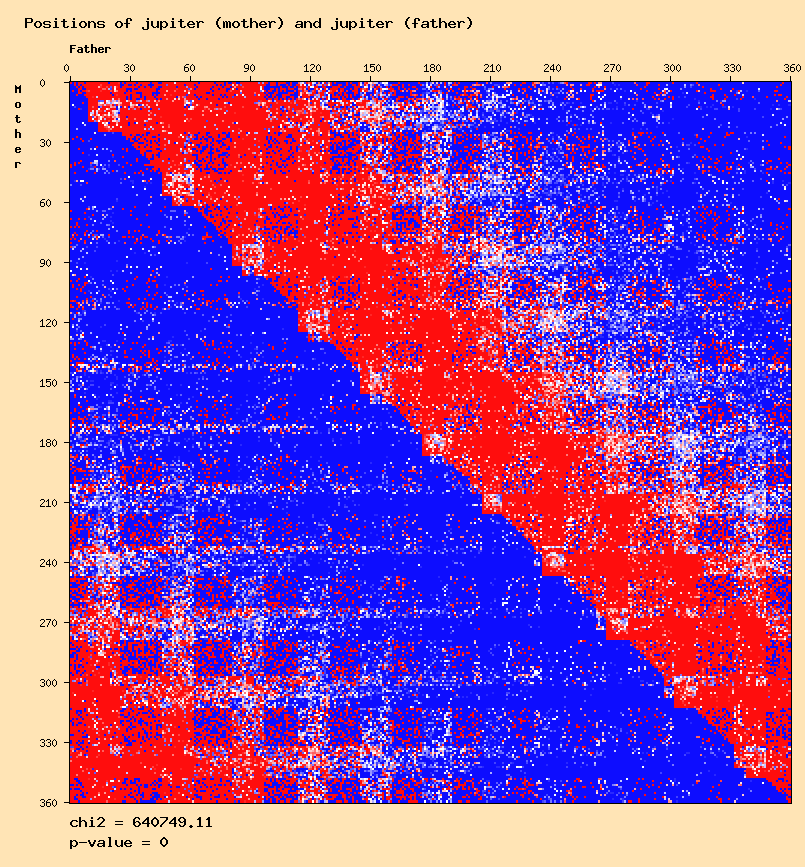
Jupiter mother - jupiter father 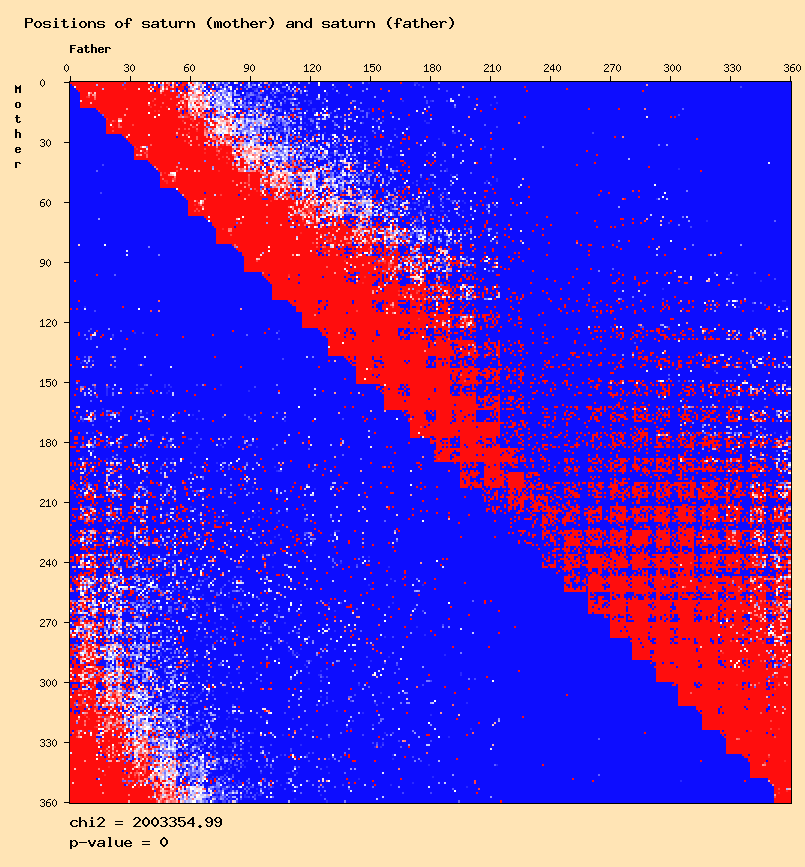
Saturn mother - saturn father 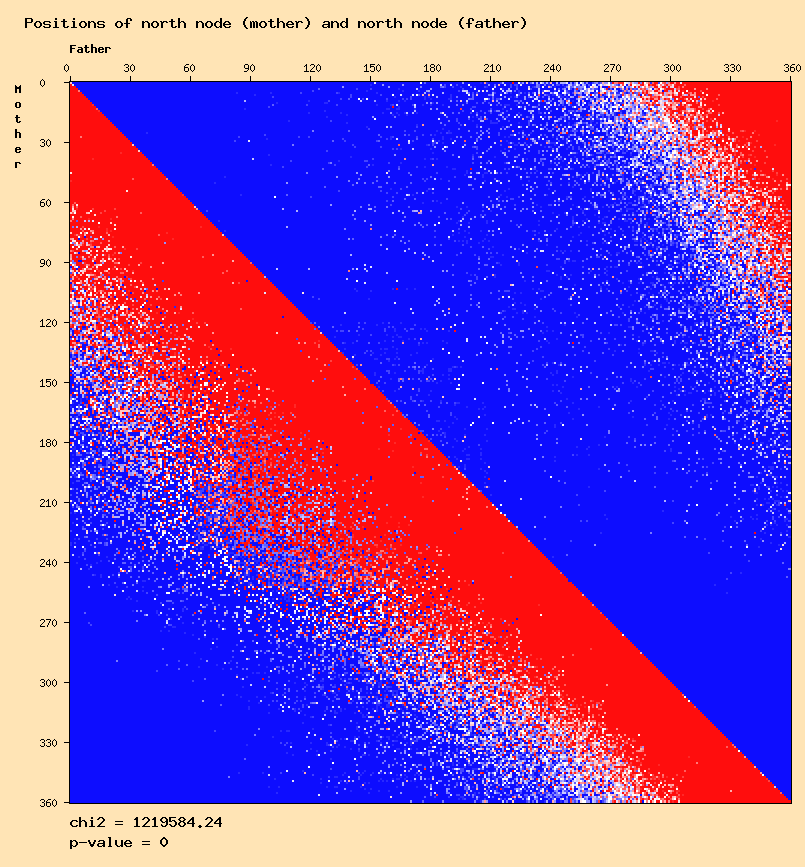
North node mother - north node father
-
Several curves show a clear difference with the expected distributions, for example:


 etc.
etc.
- And a funny fact, an excess of persons who get married around their birthday. This can be observed in the distributions of Sun mother - sun wedding and sun father - sun wedding.
Cleaning the data
In the the deaths in France study, the import process permits to eliminate 0.14 % of erroneous dates (113 677 out of 28 917 511).But the day of birth distribution shows a clearly suspect excess of births on January 1st.
How can I fix this ? Should I compute the mean value between December 31th and January 2nd and randomly suppress records to reach this mean ?
More generally, when the quality of a dataset seems to be uncertain, what are the precautions that one should take ?
Expected values
Is the "average method" appropriate ?
The "average method" is currently used to compute the expected values of distributions of two-dimensional arrays, and this seems to lead to meaningless high chi-square values.This is particulary visible on mercury or venus distributions, like this one:
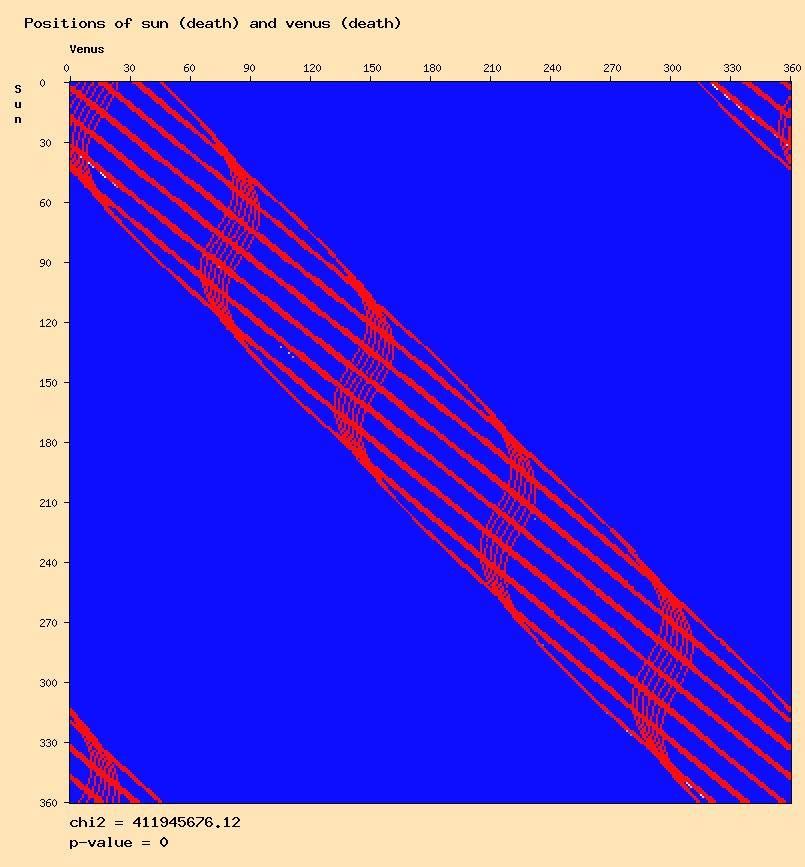
It might also explain stange patterns observed in many distributions:
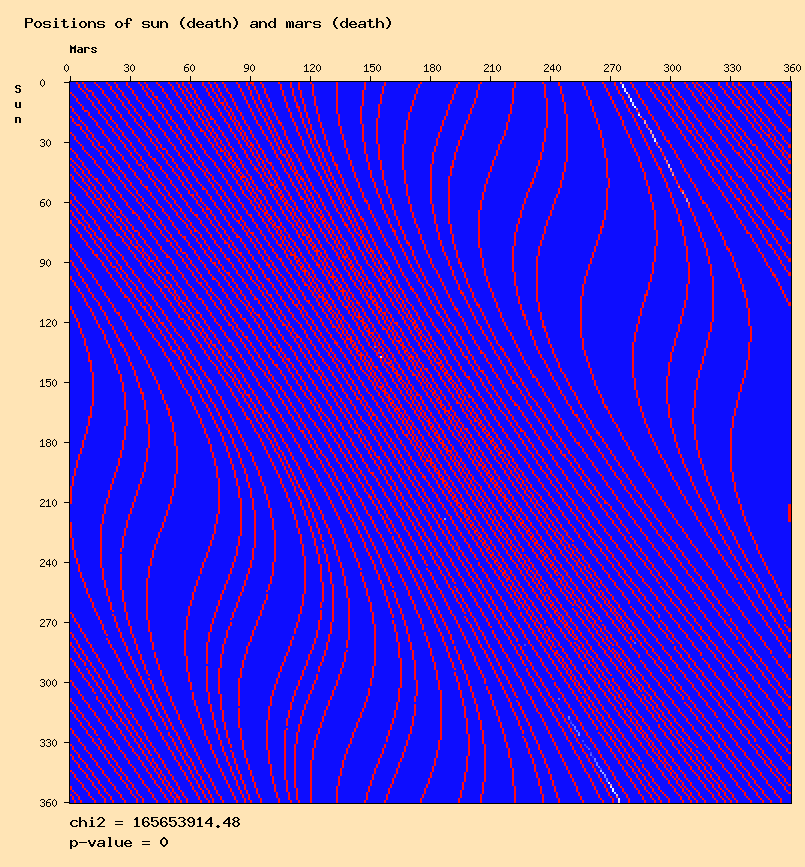
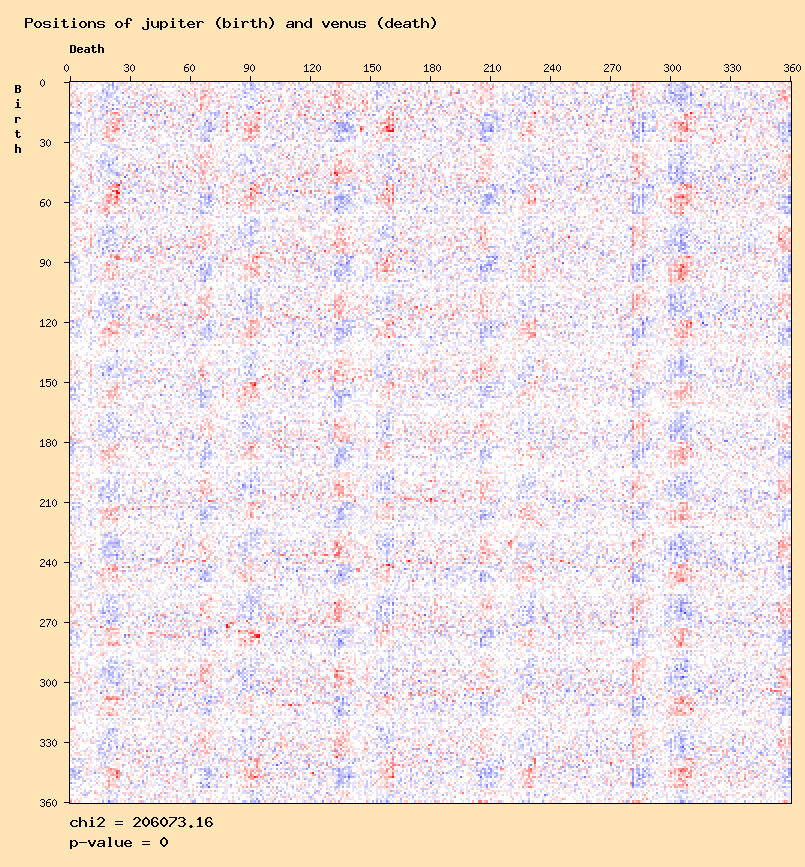
In particular, most distributions involving venus show a pattern of 5 occurences. This can be related to the astronomical movement of venus seen from the earth (see for example here), also showing 5 occurences.
These observations lead to think that the average method does not eliminate anomalies due to astronomical movements.
This can be understood with a the example of venus. Venus, like mercury, is an "inner planet" (between the sun and the earth). So, seen from earth, venus is always close to the sun (max 47°).
If we take a simplified example of 100 births and look at the angles between sun and venus and divide the 360° in 5 bins of 72°, we might observe something like this:
| 1 | 2 | 3 | 4 | 5 | Sums | |
|---|---|---|---|---|---|---|
| 1 | 24 | 0 | 0 | 0 | 0 | 24 |
| 2 | 0 | 18 | 0 | 0 | 0 | 18 |
| 3 | 0 | 0 | 20 | 0 | 0 | 20 |
| 4 | 0 | 0 | 0 | 19 | 0 | 19 |
| 5 | 0 | 0 | 0 | 0 | 19 | 19 |
| Sums | 24 | 18 | 20 | 0 | 19 | 100 |
mean of the line x mean of the column / total of the table" will produce this table:
| 1 | 2 | 3 | 4 | 5 | |
|---|---|---|---|---|---|
| 1 | 5.76 | 4.32 | 4.8 | 4.56 | 4.56 |
| 2 | 4.32 | 3.24 | 3.6 | 3.42 | 3.42 |
| 3 | 4.8 | 3.6 | 4 | 3.8 | 3.61 |
| 4 | 4.56 | 3.42 | 3.8 | 3.61 | 3.61 |
| 5 | 4.56 | 3.42 | 3.61 | 3.61 | 3.61 |
If this is correct, it means that this formula should be abandoned and replaced by control groups for two-dimensional arrays.
How many control groups should be computed ?
Is there a rule or a formula to know the number of control groups to compute ?How to compute control groups ?
In the "Death in France" study, current code just loops on birth dates, and randomly selects another person to take his / her death date. The choice of a computation method is arbitrary, and it affects the resulting control groups, which may affect the results of statistical tests. So this question seems very important to correctly perform an analysis.Statistical tests
The computation of p-value needs to be checked. Unit tests were written using data found on the web, but this is not very solid. So if someone can send me test data and the corresponding p-value, this would be great.For effect size, I'm lost in the crowd of possible formulae, I don't know which computation is pertinent here.